
Climate Change Vulnerability Assessment
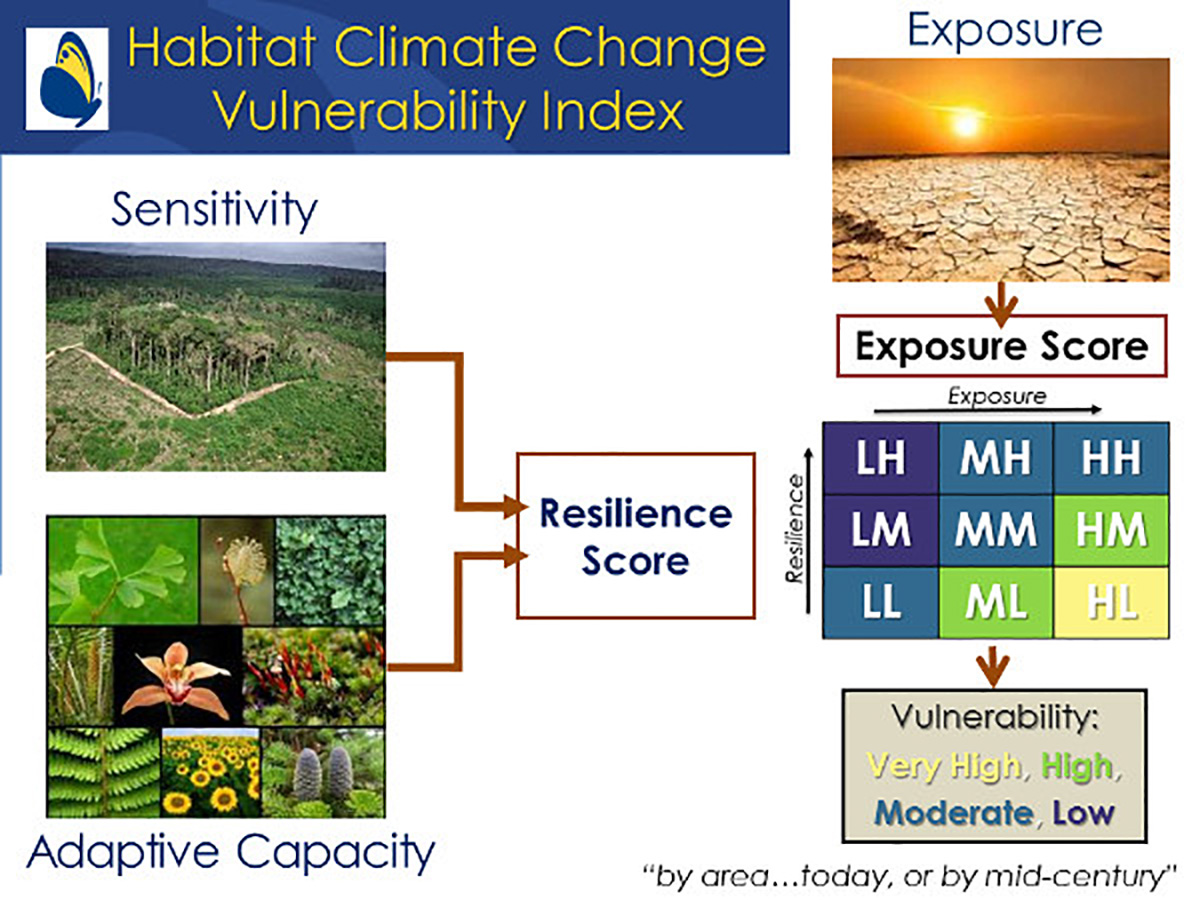
Vulnerability Assessment: Using the USNVC group level mapping across the Western U.S., the NatureServe Habitat – Climate Vulnerability Index was using 23 scientifically documented factors and indicators including for Pinyon & Juniper woodlands. The vulnerability index predicted approximately 83% scores as moderate-to-low severity and 17% scores as severe-to-very severe for the Columbia Plateau Western Juniper Woodland & Savannah group.
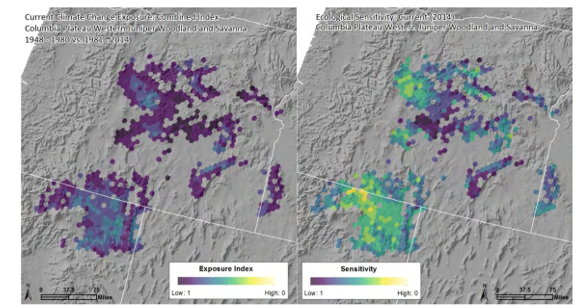
Climate exposure as of 2014 (left) and overall sensitivity (right) for Columbia Plateau Wester Juniper Woodland and Savanna. The results have been summarized and been displayed in 100 km2 hexagons. In both maps the dark purple indicates low exposure or low sensitivity, with progressively higher exposure or sensitivity (and hence higher vulnerability) indicated by the bright green to yellow.
Vulnerability Assessment of Terrestrial Vegetation: Using the USNVC Macrogroup level, UC Davis climate change vulnerability analysis assessed 30 macrogroups by analyzing dominant plant species in California to predict the sensitivity to and ability to adapt to climate change and given a set of scores to indicate how each suite of species will be impacted by climate change.
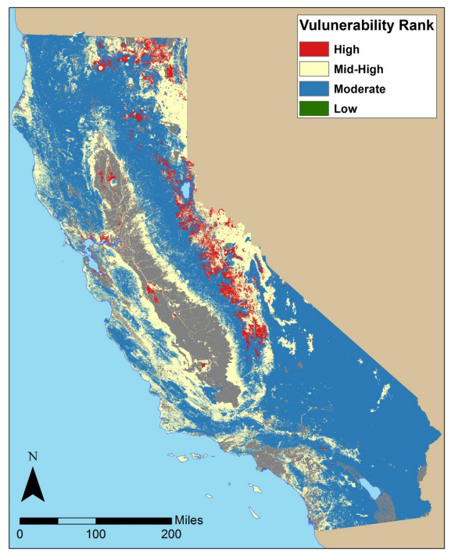
The average vulnerability rankings for macrogroups across the four climate projections is shown. Gray areas on the map represent urban and agricultural areas which were not evaluated.
Climate-Smart Adaptation Analyses
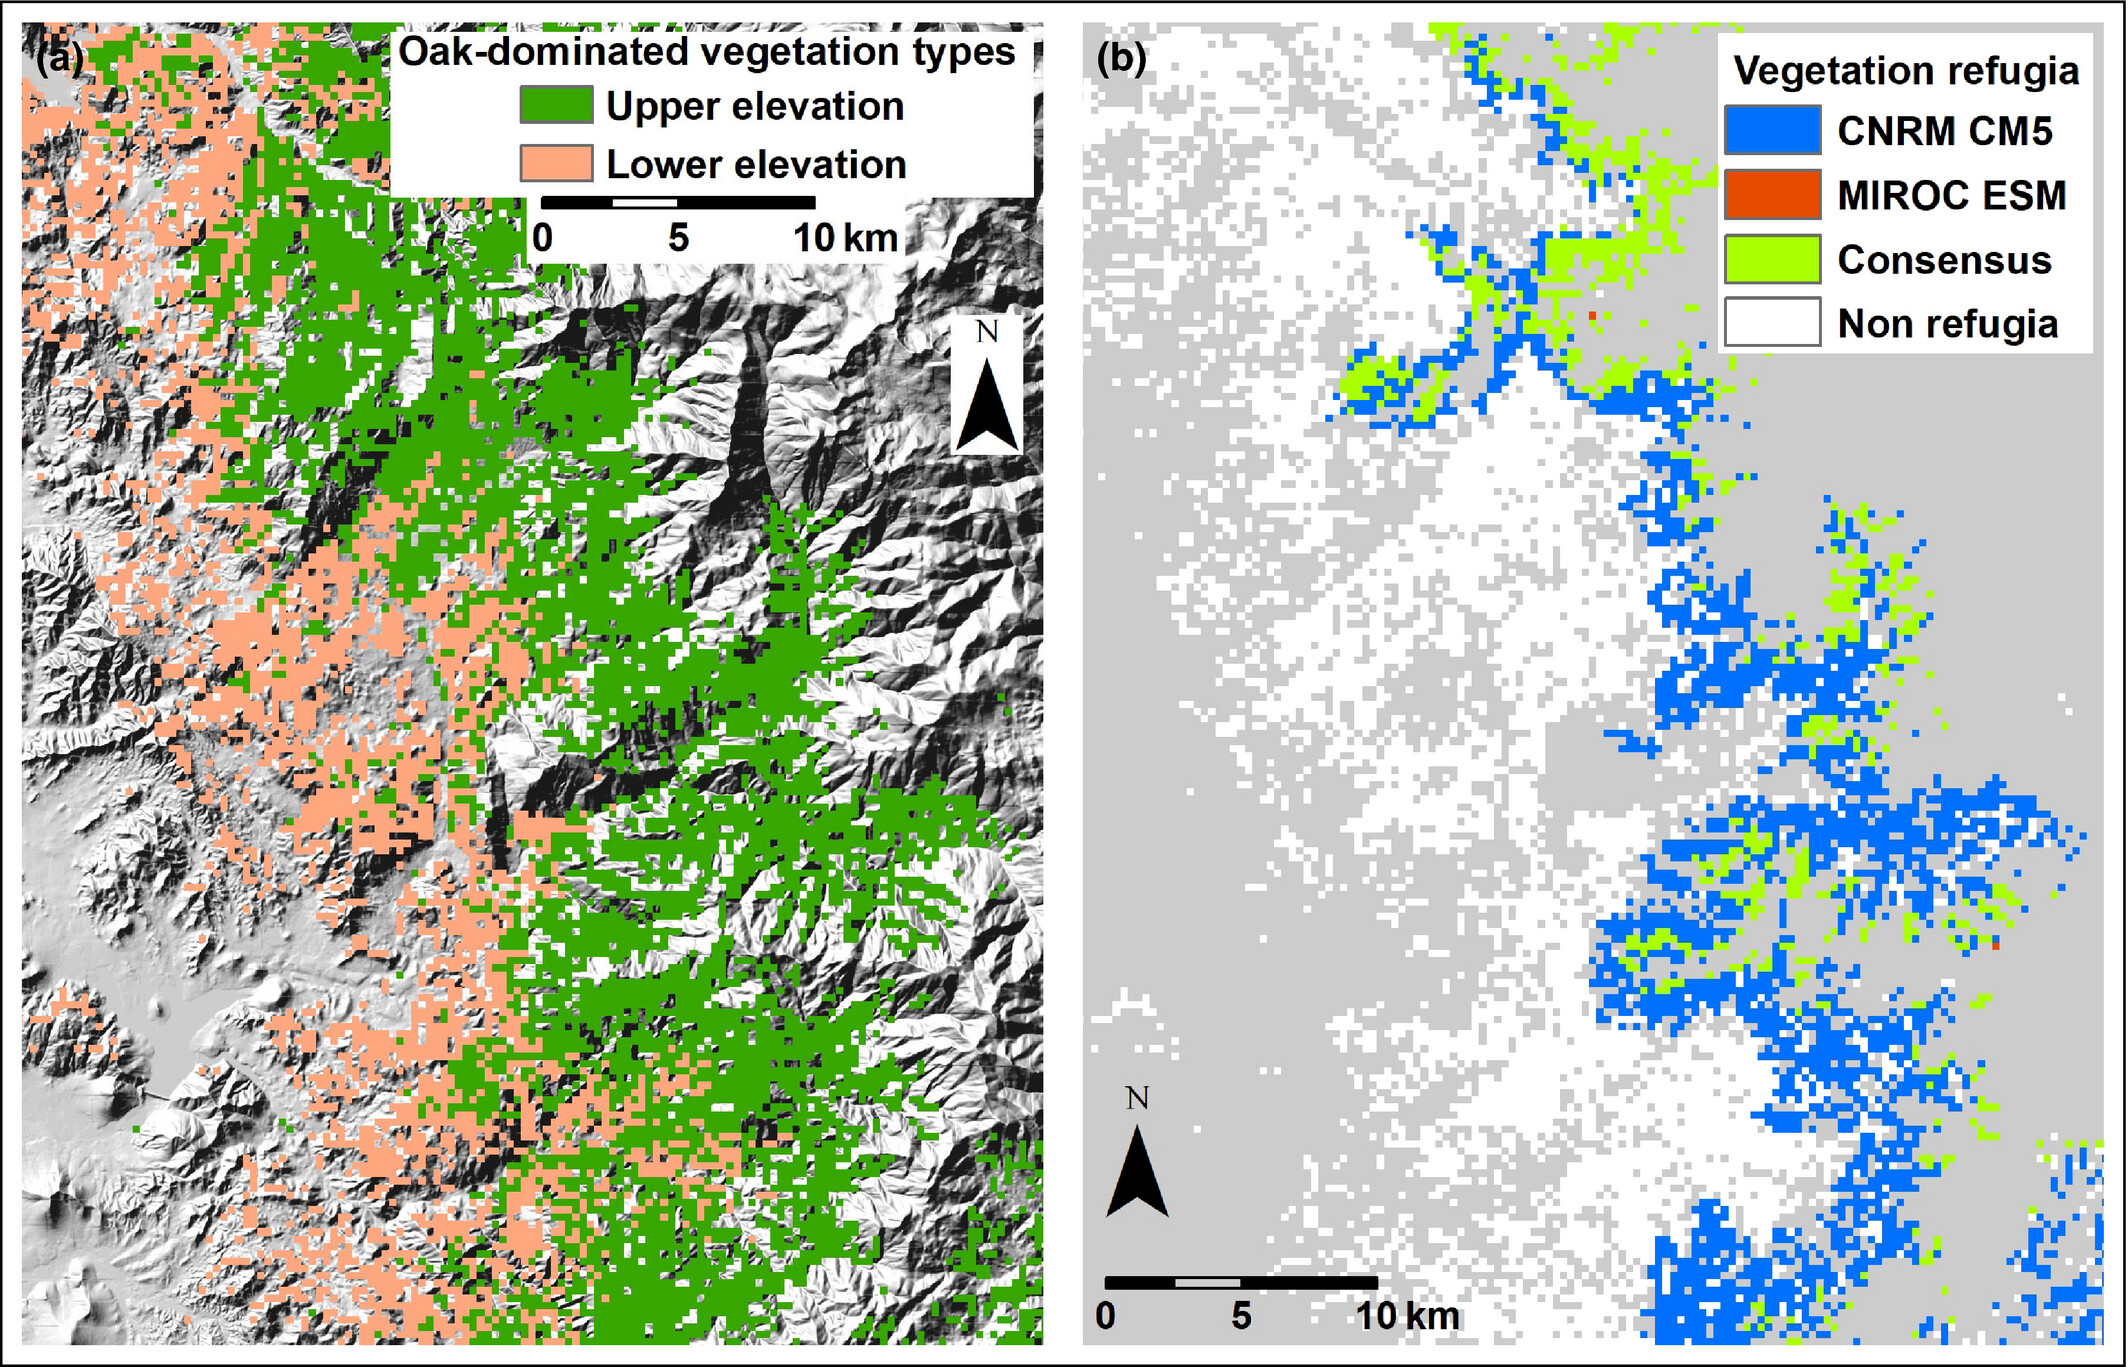
(a) At lower elevations, the southern Sierra Nevada currently contains two vegetation types dominated by blue oak (Quercus douglasii). These woodlands adjoin two upper-elevation forest types that contain black oak (Quercus kelloggii). (b) Consensus vegetation refugia are projected to be found only along the upper elevations of montane hardwood forests, suggesting an upslope retreat for that vegetation type; in contrast, no climatically suitable areas remain for the blue oak woodlands within their current extent in this area. The white area shows the current extent of all oak types mentioned, while the gray area currently is occupied by other natural vegetation types.
UC Davis, California Department of Fish & Wildlife, and U.S. Forest Service partnered on a climate change analysis project to incorporate vegetation refugia maps into conservation planning.
Vegetation refugia are areas where existing vegetation is expected to remain within current suitable climatic conditions. Consensus vegetation refugia are areas projected to remain climatically suitable under both wetter and drier future climates, which lowers uncertainty with regard to planning for the preservation of different vegetation types
•These areas can be spatially defined by combining maps of climate conditions with vegetation maps
•This simple method can help land managers allocate limited resources for climate-adaptive field work by providing a view of climate risk that varies across the lands they manage
•Large expanses of vegetation refugia may be candidates for scaled-up land management for climate resilience
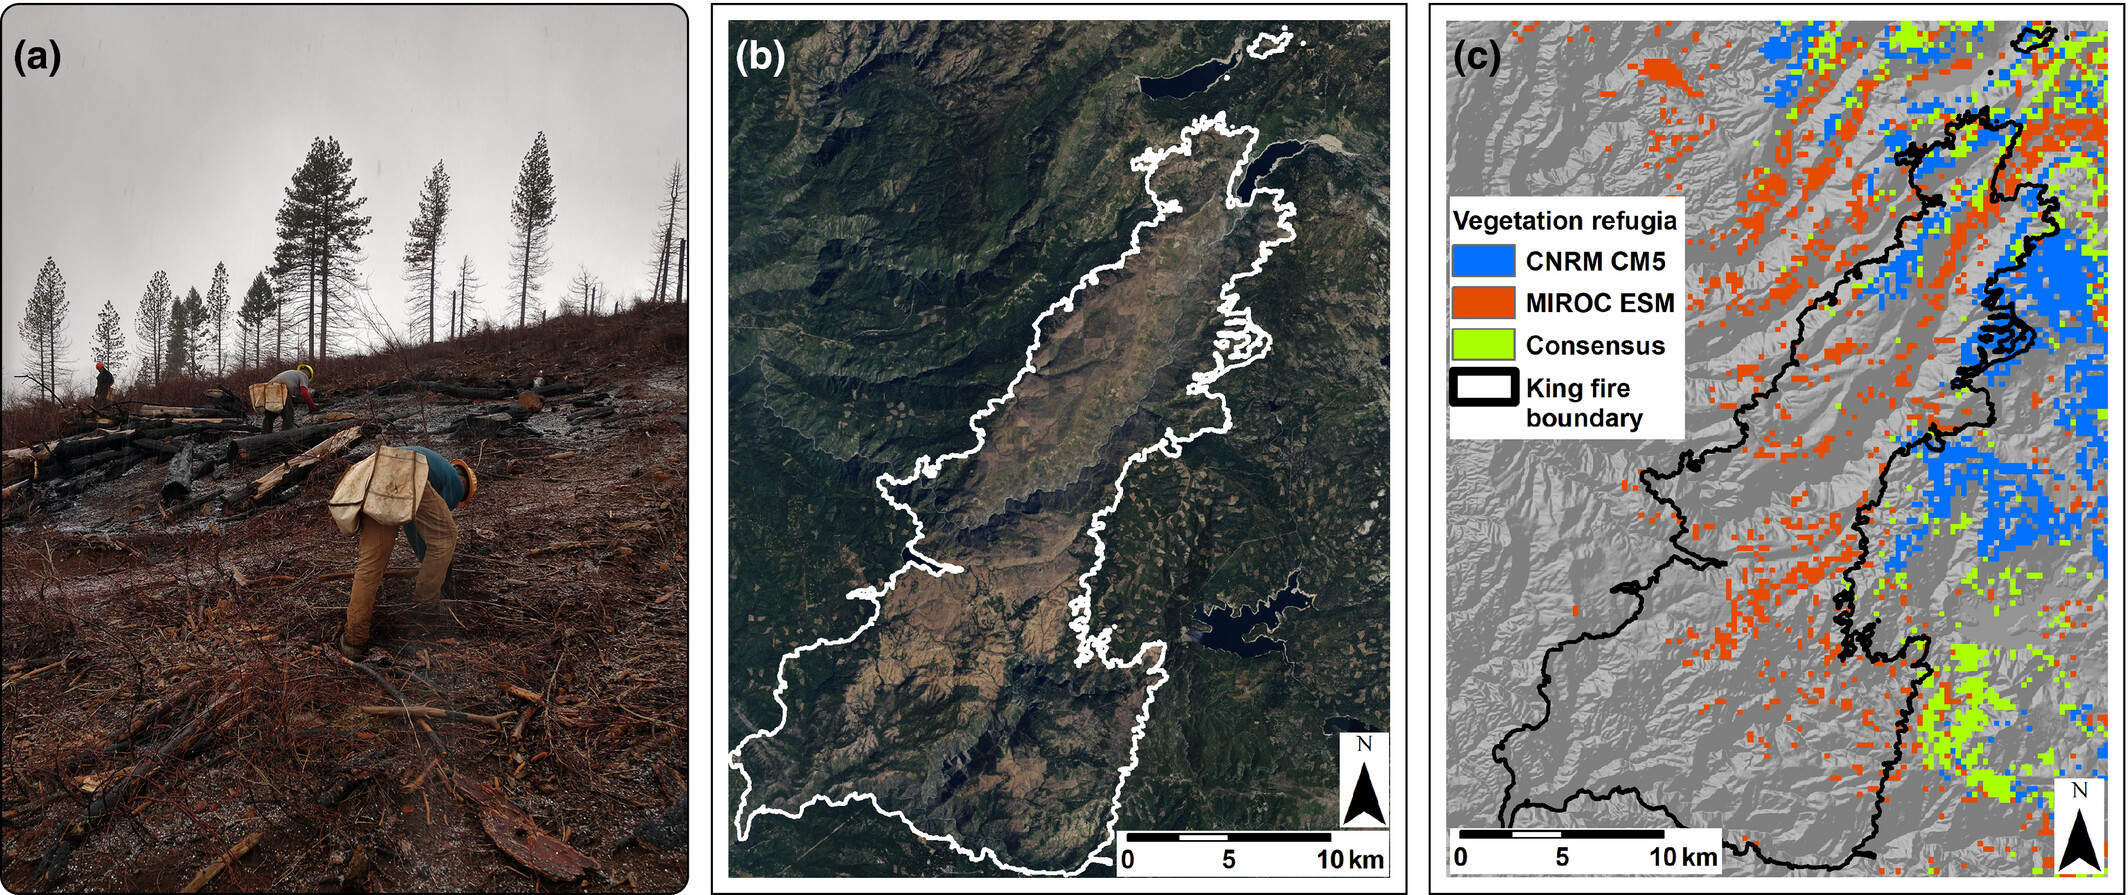
Anticipating climate-change pressures within wildfire perimeters. (a) Reforestation efforts after wildfire involve considerable planning and effort. (b) The King Fire (boundary outlined in white) burned predominantly in mixed-conifer and hardwood–conifer forests. (c) Areas of consensus vegetation refugia are zones where planting the same species as were present before the fire potentially minimizes their risk of physiological stress due to climate change. Few consensus vegetation refugia remain within the boundary; however, a band of Sierra mixed-conifer forest remains along the northern slope of a ridge (blue area) under the wetter future scenario (CNRM-CM5), and a band of mixed hardwood–conifer remains climatically suitable along a canyon (red area) under the drier future scenario (MIROC-ESM).
Climate-change Analysis to Prioritize Restoration & Conservation
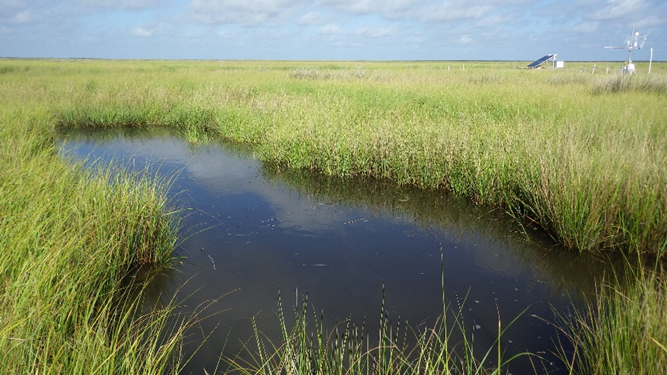
Evaluation of Sea-Level Rise & Land Management on Critical Coastal Marsh Habitat
US Geological Survey’s Wetland and Aquatic Research Center is evaluating ecosystem health in Coastal Salt Marsh habitat in the southeastern U.S. These coastal wetlands are some of the most productive and valuable habitats in the world. Louisiana contains 40% of the United States’ coastal wetlands, providing critical habitat for waterfowl and fisheries, and benefits to reduce storm surge protection for coastal communities. In terms of ecosystem services, resource production, and infrastructure investments, the value of Louisiana’s coastal wetlands exceeds $100 billion. This will be use to:
1)to identify the processes that lead to wetland loss,
2) as a baseline, to assess the impacts and the effectiveness of the planned diversion of the Mississippi River.
3) to help land managers identify vulnerable habitat, assess restoration effectiveness, and optimize restoration outcomes.
Web-based Habitat Reporting Tool to Support Monitoring and Assessment along the Louisiana Shoreline
US Geological Survey’s Louisana Barrier Island monitoring program established a system-wide assessment and monitoring using both historical and contemporary data to assess and monitor changes in the aerial and subaqueous extent of islands, habitat types, sediment texture and geotechnical properties, environmental processes, and vegetation composition. The web-based tool presents habitat maps as a snapshot of coastal habitats. The tool can be combined with historical and/or future maps to monitor these valuable resources over time. The web-based reporting tool aids in the visualization of habitat maps and habitat change maps. The results from these analyses are summarized in two habitat change products:
1) to depict change in land and water coverage
2) to highlight changes based on tidal zones
